Multiverse 2.357
paused to apply patches
Welcome to the second part of our scapy series of posts. In the previous post we discussed creating custom packets using scapy and gave some simple examples.
In this post we’ll cover common commands for operations on packets like inspecting them and for network operations like sniffing traffic. In the next post we’ll introduce programming with scapy, as it was designed to be used in Python programs.
Remember you build packets up layer by layer, each layer joined with a slash. For a listing of all the layers supported types:>>> ls()
and you’ll see an amazing list of pretty much everything from X.509 to SNMP to NTP there. But here is where you’ll start to be really impressed – get a list of commands with:>>> lsc()
Sometimes you can get help for a command by entering:>>> help(command)
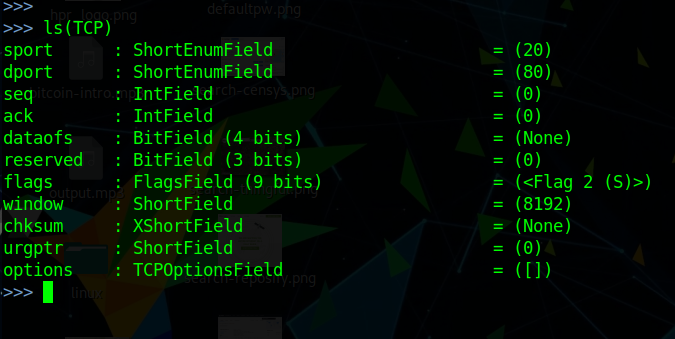
and one thing I think is useful is getting protocol details:>>> ls(protocol)
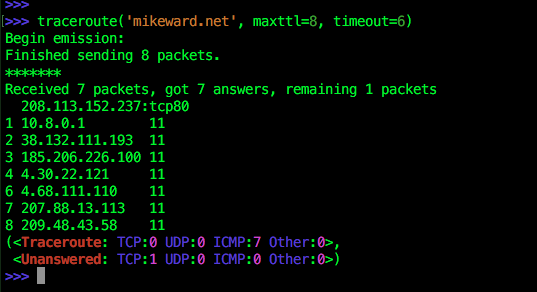
Scapy has builtin support for some higher level network operations like nmap (limited), ARP cache poisoning and traceroute. In scapy, functions like traceroute make it a simple 1-liner:
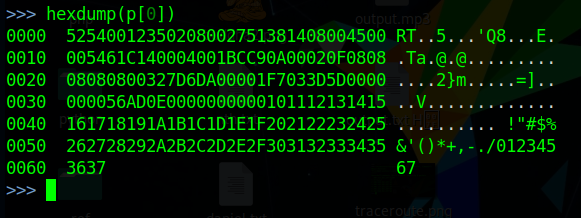
Scapy can replicate a lot of the basic scanning functionality of nmap and lets you closely examine the response data. Scapy also gives you the capabilities of wireshark, including viewing all headers and even the hexdump for a packet.
Actually when you have captured some packets, you can type:>>> wireshark(mypackets)
and it’ll open wireshark with those captured packets. I feel like Billy Mays, the famous television pitchman, “But wait, there’s more!”
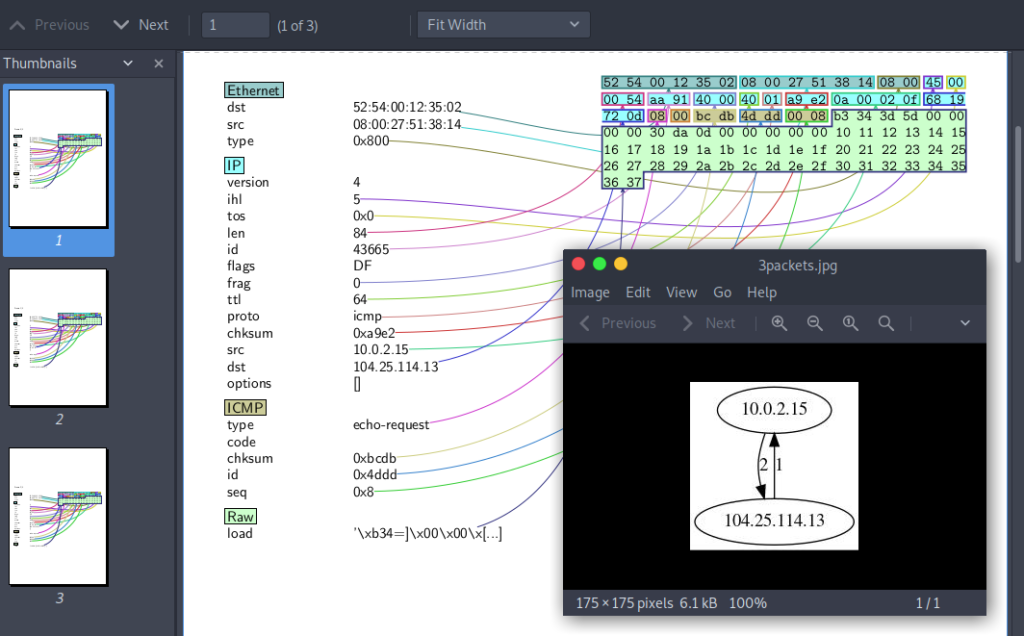
I mentioned that scapy can sniff network traffic and record every detail just like tcpdump or wireshark. What I didn’t mention was that you can easily write that to a pcap file or read data from them, and you can export and graph the results in any number of ways. Scapy supports exporting packet capture data to PDF or Postscript, along with detailing conversations as images, or plotting results using Matplotlib.
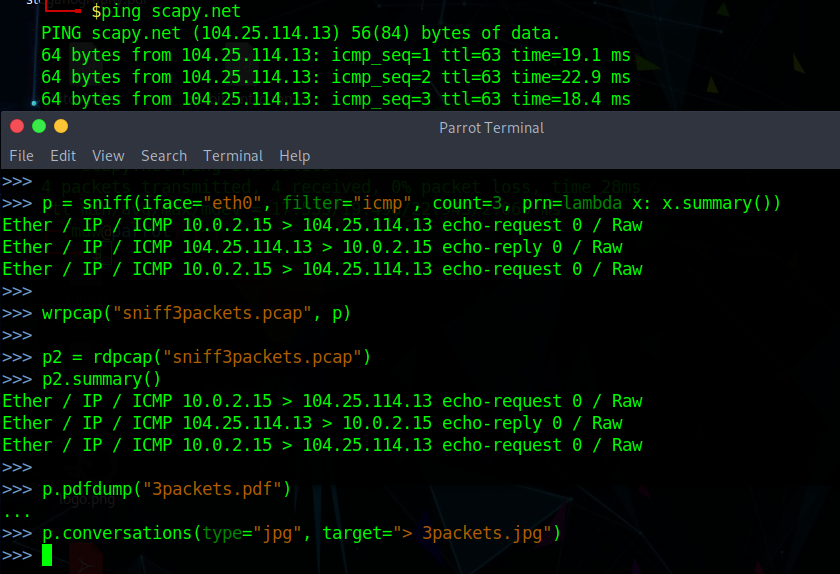
As you can see from the screen capture above, you can easily sniff network traffic and display it in terse or verbose formats from the summary short style to the full packet contents – I chose summary here. Let’s break down this sniff() command to see what’s going on.>>> p = sniff(iface="eth0", filter="icmp", count=3, prn=lambda x: x.summary())
I’m telling scapy to sniff packets on eth0 interface, filtering for type ICMP, capture 3 packets. The prn argument specifies to call the summary() function for each packet – the prn argument is used to specify a function to apply to each. Don’t forget help(sniff) if you want to look up the possible arguments for this command.
As you can probably guess, wrpcap() writes a packet capture out to disk and rdpcap() reads a pcap file. What you might not have expected was how easy it is to put this data in visual formats. The pdfdump() command lets me dump a graphical representation to a PDF file, and there’s a psdump() for Postscript. An ongoing series of interactions between hosts can be graphically exported using the conversations() function, although there are some dependencies that might need to be installed.
This is a lengthy post, but I wanted to convince anyone reading this that scapy is a powerful, flexible and easy to use tool and well worth investing some time to learn. Unfortunately there is quite a lot that I didn’t get to even mention, let alone show so there might need to be an extra post after the next one just for all the stuff I’ve left out so far.
I talked about how to do basic things using scapy interactively, including creating custom packets layer by layer, and using the robust set of built-in scapy commands, but that’s just part of the story. In the next post we’ll cover getting started using scapy in programming projects, so stay tuned.